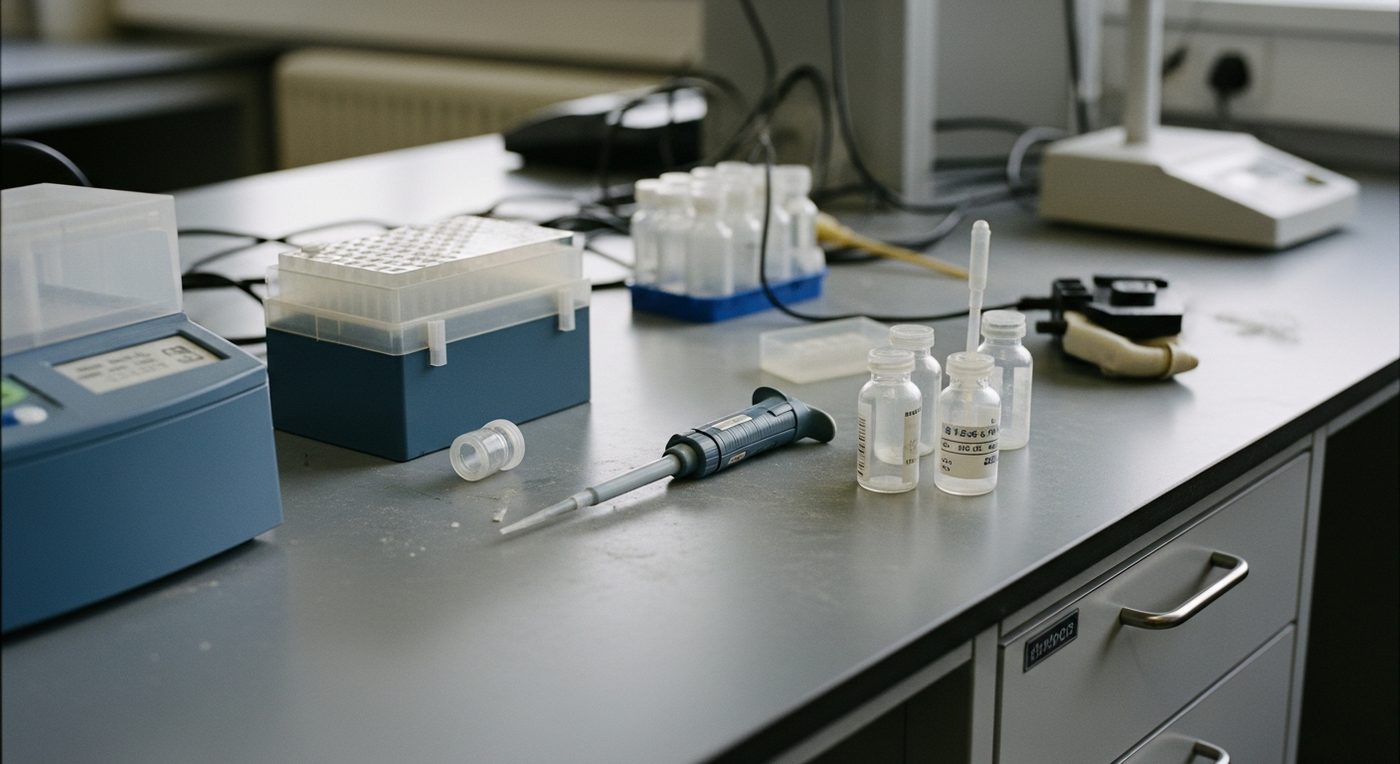
How we value biotech companies
Why nothing conventional works here
A biotech in clinical development has no revenue, no earnings and often only one meaningful programme. Its value hangs on an event that either happens or does not: a trial reads out positive, or it does not.
That binary profile cannot be captured with multiples. But it can be calculated — with probabilities.
rNPV: risk-adjusted net present value
We value each programme separately and add them up:
rNPV = Σ (expected cash flows per programme × cumulative probability of success)
       discounted to today
     − ongoing corporate costs
     + net cash
The decisive factor is the cumulative probability of success from the current phase. The calculation step by step is on the metric page rNPV.
Phase transition probabilities
Our starting point is the joint analysis by BIO, Informa Pharma Intelligence (Biomedtracker) and QLS Advisors, Clinical Development Success Rates and Contributing Factors 2011–2020 — covering 12,728 phase transitions from 9,704 development programmes across 1,779 companies. The survey window is not the full decade but 1 January 2011 to 30 November 2020.
| Transition | Success rate | n |
|---|---|---|
| Phase I → Phase II | 52.0% | 4,414 |
| Phase II → Phase III | 28.9% | 4,933 |
| Phase III → NDA/BLA | 57.8% | 1,928 |
| NDA/BLA → Approval | 90.6% | 1,453 |
| Likelihood of approval from Phase I (all indications) | 7.9% | 12,728 |
Two things stand out. First: Phase II is the hardest hurdle, not Phase III. Anyone valuing a Phase II company is valuing a scenario that, more than 70% of the time, does not happen. Second: of a hundred compounds in Phase I, eight reach approval.
The spread by indication is enormous
The 7.9% average is close to useless as a model input. By disease area (cumulative likelihood of approval from Phase I, same source, Figure 5b):
| Disease area | LOA from Phase I |
|---|---|
| Haematology | 23.9% |
| Metabolic | 15.5% |
| All indications | 7.9% |
| Oncology | 5.3% |
| Urology | 3.6% |
Using the average for an oncology programme overstates it by roughly 50%. For a haematology programme it understates it by two thirds.
The confusion waiting inside the same document. Figure 5b shows the cumulative probability across all four transitions. Figure 2 shows the success rate for a single phase. Both tables are sorted by the same disease areas and look almost identical. Metabolic programmes come in at 61.8% in Phase I — that is the jump into Phase II, not the road to approval, which is 15.5%. Mistake one for the other and you are out by a factor of four.
So in every analysis we state the probability used, its source and the reasoning behind the adjustment — by indication, mechanism of action (validated or novel) and trial design. The table above is the starting point, not the answer. Where the figures come from, and when a departure from them is justified, is set out under probabilities of success by clinical phase.
Peak sales: the second large assumption
Peak sales = target population × diagnosis rate × treatment rate
             × achievable market share × price per patient per year
Each of these five factors is disclosed separately in the analysis. The most common error in biotech valuation is a market share assumption nobody questions: 30% share in a field with four approved competitors is not an assumption, it is a wish.
This also covers the timeline to market and the patent runway — a product with five years of exclusivity after approval is a different asset from one with twelve.
Discount rate
10 to 13%. No higher, despite the risk: clinical risk is already carried by the probability of success. Layering it a second time into a very high discount rate double-counts the same risk and drives every programme to zero. That is the methodological core of rNPV, and it is routinely violated in practice.
The range is a convention of valuation practice, not a standard — no accounting standard and no regulator prescribes it. Alacrita, a life sciences advisory firm, cites it as the customary corridor; a survey of large biotech companies produced a median of 10%. Anyone departing from it has to be able to justify the departure — and we state the rate used in every analysis.
Cash runway: the metric that decides everything
For every clinical-stage company we disclose:
- Cash at the reporting date
- Quarterly burn rate
- Runway in months
- Does the cash extend beyond the next data point?
That last question is the most important in the whole model. A company that must raise before readout negotiates from weakness and dilutes accordingly. One that can wait for the data finances afterwards on entirely different terms — or not at all, because it finds a partner. How we calculate runway and dilution is set out under cash runway.
What this method cannot do
- rNPV is extremely sensitive. Moving the probability of success from 30% to 40% moves the value by a third. That is why we always publish three scenarios and a sensitivity table — a single point value would be misleading.
- It does not capture partnerships. A licensing deal with an upfront payment and milestones changes the profile fundamentally and cannot be modelled in advance.
- Safety signals are not quantifiable. A programme can fail on side effects even though it works.
- Platform value is not captured. A technology that may spawn further programmes is not in the rNPV of today's pipeline.
Foodtech and cell culture
We treat cellular agriculture and food biotechnology within this framework, with two differences: regulatory approval steps replace clinical phases (in the EU, the Novel Food Regulation), and cost parity with the conventional product replaces reimbursement pricing. As long as production costs are a multiple of the reference product, the addressable market is theoretical.
What we do not do
We do not adopt a peak sales estimate from a corporate presentation. We do not apply a probability of success without evidence for it. We do not present a discount rate as a standard when it is a market habit. And we do not publish an rNPV without scenarios — at this level of sensitivity, a single figure would be false precision.
Sources
- BIO, Informa Pharma Intelligence, QLS Advisors: Clinical Development Success Rates and Contributing Factors 2011–2020. Survey window 1 January 2011 to 30 November 2020; 12,728 phase transitions, 9,704 programmes, 1,779 companies. Phase rates from Figure 2, cumulative figures by disease area from Figure 5b. go.bio.org
- Alacrita: Valuing Pharmaceutical Assets — When to Use NPV vs rNPV. Basis for the customary discount rate corridor of 10 to 13%. alacrita.com
What changed in version 2
11 August 2026. We checked the figures on this page against the primary sources. One of them was wrong.
- The discount rate was given as 10 to 14%. What is documented is a corridor of 10 to 13%: that is how Alacrita, a life sciences advisory firm, describes it, and a survey of large biotech companies gives a median of 10%. The upper bound in version 1 was not supported. It is now also explicitly marked as a convention of practice — no standard prescribes a discount rate. The methodological argument is unchanged: because the probability of success already carries the development risk, an inflated discount rate counts the same risk twice.
- The clinical success rates were checked against the original and confirmed: 52.0%, 28.9%, 57.8%, 90.6% and 7.9% cumulative from Phase I; by disease area 23.9%, 15.5%, 5.3% and 3.6%. Added: the full report title, the actual survey window of 1 January 2011 to 30 November 2020, and the warning about confusing Figure 2 with Figure 5b.
- New: a list of sources.
No published valuation is affected. aktienanalyse.online operates in "start without an analyst" mode: we publish neither a fair value nor price targets. Not a single valuation was issued under version 1 of this page that relied on the old figures.
Version 2 · 11 August 2026